Bitcoin Price Wobbles Below Resistance – Could a Fresh Drop Follow?
NewsBTC
2025-08-06 10:40:08


Bitcoin price is struggling to recover above the $116,200 zone. BTC is now consolidating and might decline further below the $112,500 zone.
- Bitcoin started a fresh decline from the $115,500 zone.
- The price is trading below $114,000 and the 100 hourly Simple moving average.
- There is a bearish trend line forming with resistance at $114,400 on the hourly chart of the BTC/USD pair (data feed from Kraken).
- The pair might start another increase if it clears the $115,500 resistance zone.
Bitcoin Price Faces Resistance
Bitcoin price found support near the $112,000 zone and started a recovery wave. BTC was able to climb above the $113,200 and $114,000 resistance levels.
The price climbed above the 23.6% Fib retracement level of the downward move from the $118,918 swing high to the $112,000 low. However, the bears were active near the $115,500 resistance and the price struggled to continue higher.
The 50% Fib retracement level of the downward move from the $118,918 swing high to the $112,000 low acted as a resistance. Bitcoin is now trading below $114,000 and the 100 hourly Simple moving average. There is also a bearish trend line forming with resistance at $114,400 on the hourly chart of the BTC/USD pair.
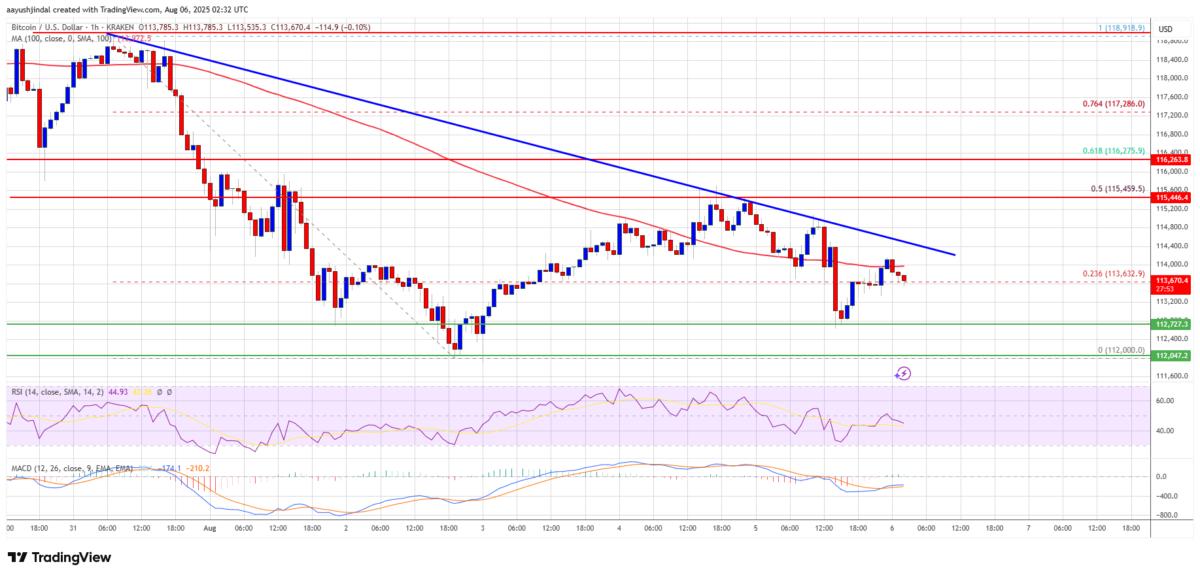
Immediate resistance on the upside is near the $114,000 level. The first key resistance is near the $115,000 level. The next resistance could be $115,500. A close above the $115,500 resistance might send the price further higher. In the stated case, the price could rise and test the $116,500 resistance level. Any more gains might send the price toward the $118,000 level. The main target could be $120,000.
Another Decline In BTC?
If Bitcoin fails to rise above the $115,000 resistance zone, it could start another decline. Immediate support is near the $113,200 level. The first major support is near the $112,500 level.
The next support is now near the $112,000 zone. Any more losses might send the price toward the $110,500 support in the near term. The main support sits at $108,500, below which BTC might continue to move down.
Technical indicators:
Hourly MACD – The MACD is now gaining pace in the bearish zone.
Hourly RSI (Relative Strength Index) – The RSI for BTC/USD is now below the 50 level.
Major Support Levels – $112,600, followed by $112,000.
Major Resistance Levels – $115,000 and $115,500.
최신 뉴스
CoinNess
2025-08-10 23:09:38
CoinNess
2025-08-10 22:03:31
CoinNess
2025-08-10 19:00:00
CoinNess
2025-08-10 17:00:00
CoinNess
2025-08-10 15:00:09